SWMMPLOT
The
SWMMPLOT command creates time series plots from SWMM.
To create a SWMM Time Chart, follow these instructions:
- Have Drainage Networks or Sewage Networks enabled for SWMM
If no network is enabled, it will not be possible to calculate with the SWMM engine and therefore, no graphics can be drawn
- On all networks listed above, ensure that all devices have the
Swmm indicating a type of node / link.
This association between SOLIDOS devices and SWMM is carried out within the device's Constructor Simulation start and end dates should ensure that multiple date/times are simulated so that there are values to show
- Run the command
 SWMMCALC, if you haven't already run it
 Note: that using the command
SWMMCALC assumes that checks
necessary have been made. See the help for this command for more information.
Note: that using the command
SWMMCALC assumes that checks
necessary have been made. See the help for this command for more information.
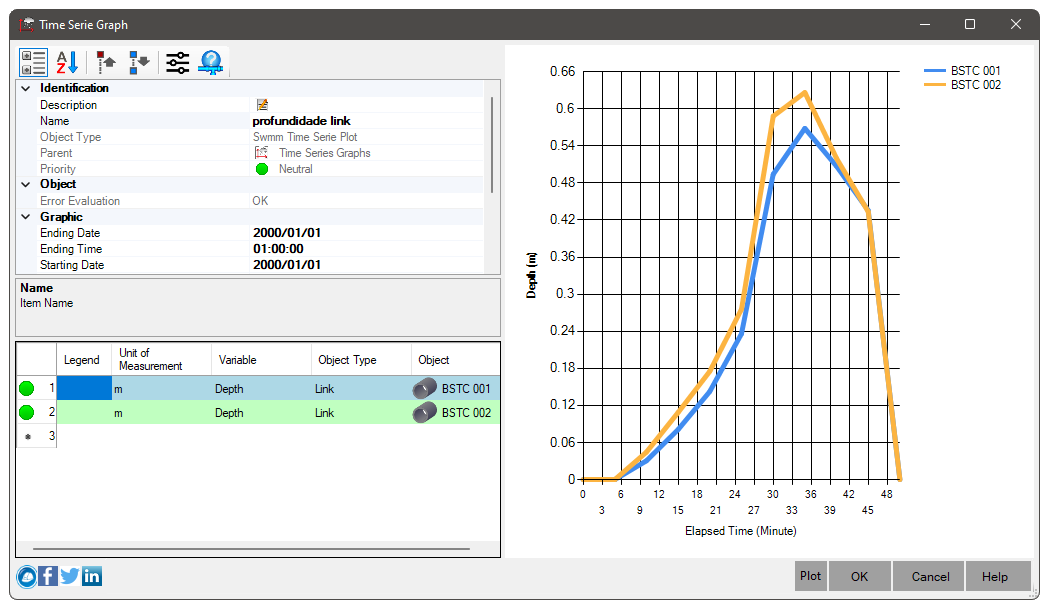
- Call the
SWMMPLOT command and fill in the start and end date/time of the graph.
Note: that the initial values match those of the simulation, when creating a new graph:

- Add items to the series table:
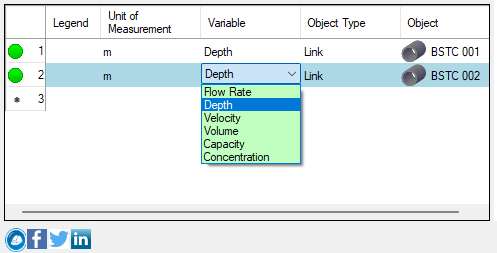
- Choose the object type, then choose the variable to be listed and the measurement unit
- Double-click on the cell of the Object column, to select in the Model Space the device or subcatchment
when necessary
- Note that the green dot
 may turn red if all data is not provided
- Click the Plot button, next to the OK button and see the result: