 SWMM - Time Serie Plot
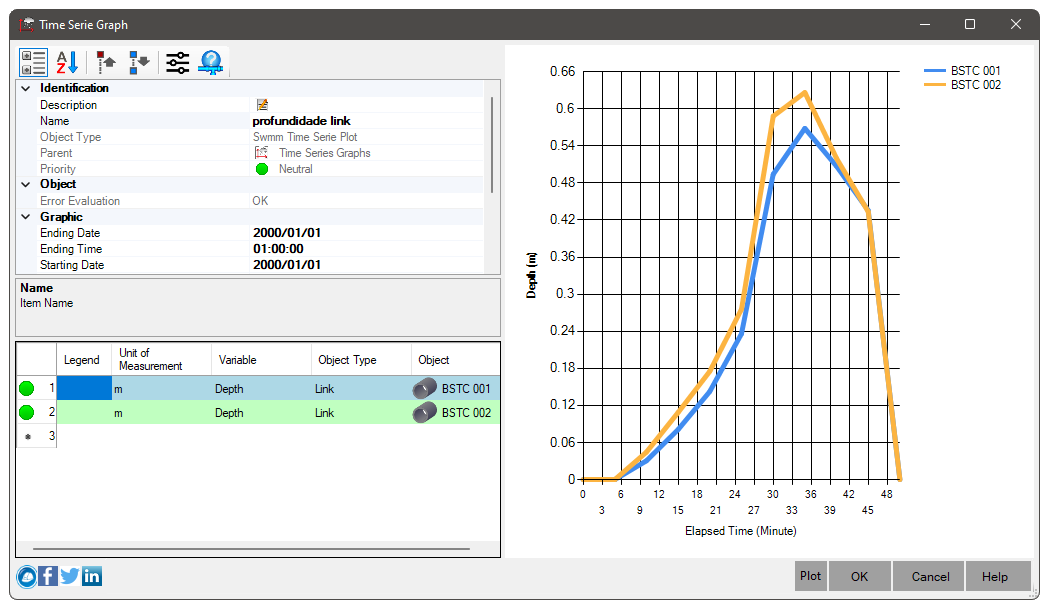
A SWMM temporal graph shows simulation information as a function of time elapsed in the simulation.
This simulation must have a different start date/time than the end date/time of the simulation and a non-zero range for it to produce results.
(see the topic Swmm / Datas to learn more.

A temporal simulation graph has the following properties:
- Identification
- Description - Use a friendly description when the item name is not enough
- Name - Item Name
- Priority - Information about the current state of the item. Could it be:
Neutral: no problem
Warning: some problem, but that does not prevent the use or calculation
Critical: Some issue that prevents the item from being calculated or used
- Object Type - Object Type
- Object
- Error Evaluation - Data evaluation result
The data provided is evaluated so that the graph can be drawn. If it cannot, one of the errors below may appear:
- SWMM is not working. calculated - use the command
 SWMMCALC to calculate
- Insufficient data - Missing data items in series worksheet - add at least one item to worksheet:

- Range - indicates that the chart range is not set. contained in the simulation range:
- The start date/time of the chart is set. less than the simulation start date/time
- The end date/time of the graph is set. greater than the simulation end date/time
- The start date/time of the chart is set. equals The graph end date/time
- Are any of the time series missing? with problems - note which grade is currently in trouble. marked with red dot
 :
:

- Chart - indicates the start and end of the chart
- End Date - Date the chart ends
It must be less than or equal to the end date of the simulation
- Start Date - Date the chart starts
It must be greater than or equal to the simulation start date.
- End Time - Time the graph ends
It must be less than or equal to the end time of the simulation
- Start Time - Time when the graph starts
It must be greater than or equal to the start time of the simulation.
- X-axis - X-axis format
Could it be:
- Date - data are shown on their respective dates
- Elapsed time - data is shown relative to the start of the simulation in days, hours, minutes or seconds
- Swmm - Indicates which swmm is required. the start and end of the simulation
- End Date - Date the simulation should end
- Start Date - Date when the simulation starts
- End Time - Time at which the simulation should end
- Start Time - Time of day the simulation starts
In order for a graph to be plotted, it is required. It is necessary to provide data. This data can come from:
- Nodes - the SWMM nodes
É It is necessary to select the node. of the network you want to monitor
- Depth
- Hydraulic Load
- Volume
- Lateral Affluence
- Total Affluence
- Flooding
- Concentration - of the first pollutant
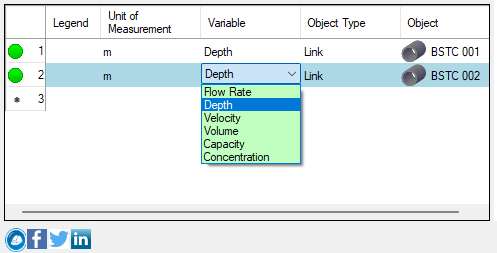
- Links - the SWMM links
It is necessary to select the link of the network that you want to monitor.
- Flow
- Flow Depth
- Speed
- Volume
- Capacity - filled fraction of conduit
- Concentration - of the first pollutant
- Sub-Catchments - the SWMM contribution catchments
É it is necessary to select the sub-basin of the network that you want to monitor
- Precipitation
- Snow Depth
- Evaporation
- Infiltration
- Outflow
- GW Affluence
- GW Lift
- Soil Moisture - moisture content of the unsaturated zone
- Concentration - of the first pollutant
- System - Swmm data
- Temperature
- Precipitation
- Snow Depth
- Losses
- Outflow
- DW Affluence
- GW Affluence
- I&I Affluence
- Direct Affluence
- Total Affluence
- Flooding
- Stream Output
- Storage
- Evaporation
To create a time serie plot, use the command
 SSWMMPLOT


![]() SSWMMPLOT
SSWMMPLOT