 SWMMCURVES
SWMMCURVES
SWMMCURVES
The command
SWMMCURVES creates and edits  SWMM Curves
To use, call SWMMCURVES from the command line, menu, toolbar or Ribbon and choose the style you want to edit:
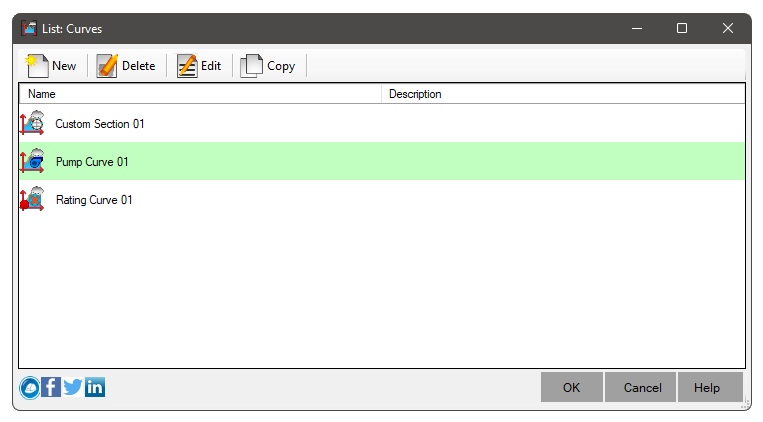
On this screen you can:
 New - Create a new curve
 Delete - Delete selected curves if not in use
 Edit - Edit the selected curve
 Copy - Copy and edit the selected curve
 Pick - select on the screen an item that has the curve you want to edit
When clicking the button
New, you will be asked to choose the type of curve:
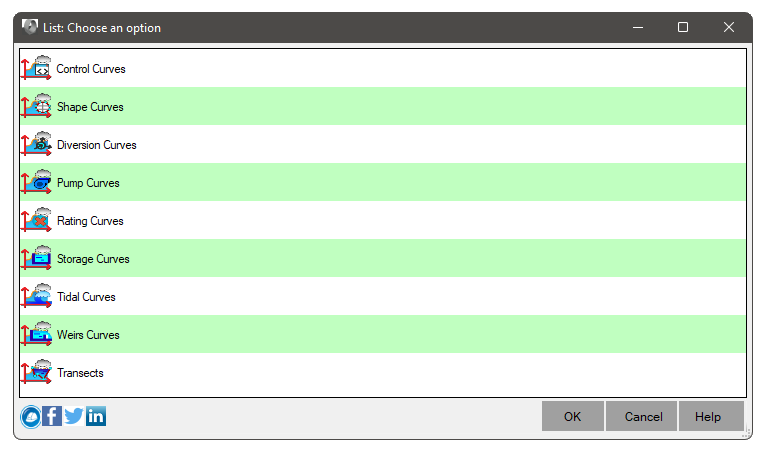
There are 9 types of curves in SWMM:
 Control Curve - describes the range of value/setting values in
  LID Controls
 Shape Curve - describes the variation of the values of the Width/(Total Height) ratio as a function of the Depth/(Total Height) ratio in
Non-standard sections of SWMM that are regular
Shape Curve - describes the variation of the values of the Width/(Total Height) ratio as a function of the Depth/(Total Height) ratio in
Non-standard sections of SWMM that are regular
 Diversion Curve - describes the variation of output flow rate values as a function of input flow rate in
  SWMM Flow Dividers
 Pump Curve - describes the flow variation as a function of load/depth in
  SWMM Pumps
 Discharge Curve - describes the flow variation as a function of elevation in
  SWMM Outlet
 Storage Curve - describes the variation of flooded area as a function of depth in Nodes of SWMM
 Tidal Curve - describes the variation of tidal height as a function of time of day in
  SWMM Outfalls
 Spill Curve - describes the variation of the Weir coefficient as a function of load in
  SWMM Weirs
 Transects - describes the Irregular cross-section of channels
in SWMM
Transects - describes the Irregular cross-section of channels
in SWMM
After choosing the type of curve, click the OK button and the following screen is shown:

 SWMMEXPORT and the name must be limited to 31 characters
See also:
 SWMMPATTERNS - to edit Time Patterns
 Note: To be able to Use this command, a
license is required. Otherwise, you will only be able to view the already existing curves.
Note: To be able to Use this command, a
license is required. Otherwise, you will only be able to view the already existing curves.