Reports
After the calculations have been processed, you need to generate the distribution reports.
To access these reports, click:

The DDM program creates various types of reports:
-
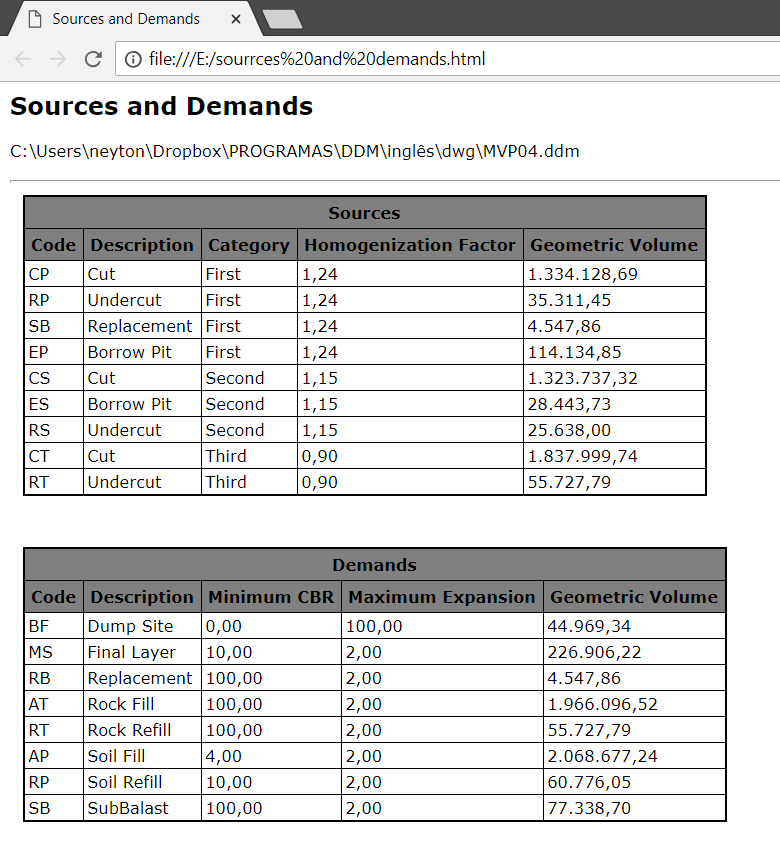
Sources and Demands - Shows the names and codes
-
Areas and Volumes - Areas of all sources and demands of the project are displayed:
Ā

-
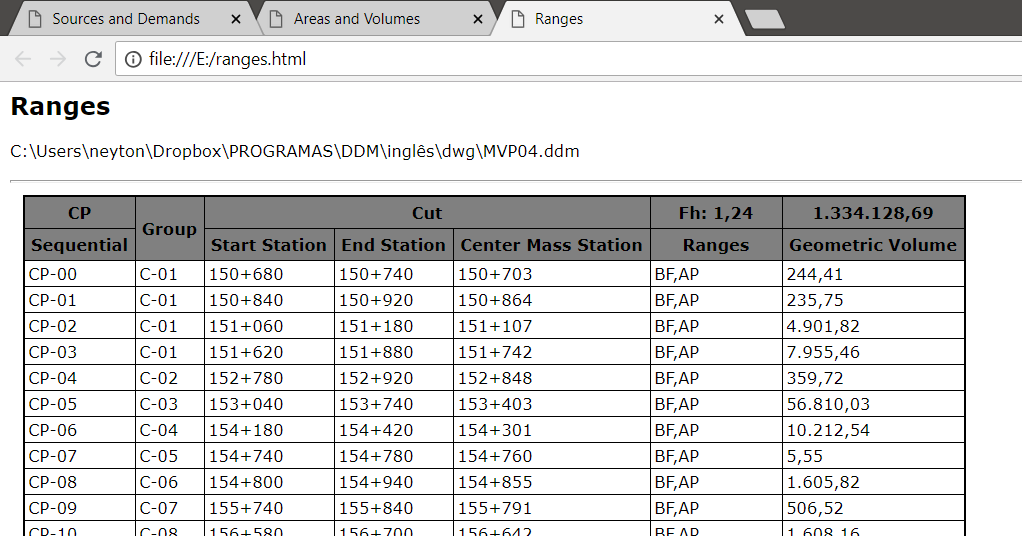
Ranges - These are the tables with the sources ranges and demands ranges used in the distribution
-
Distribution table - also called QDT.
It is the calculated tab and shown in the Results tab.
If there are errors in this tab, the corresponding cell in the report will
remain in red, indicating the error.
Ā

-
Summary tables - also called QRT.
In them are shown the items of:
-
Excavation, Load and Transport, given by DMT tracks and category.
-
Extraordinary Moment, sum of extraordinary moments by category
-
Landfills Compactations, show the volume sums (geometric volume of the destination) by type of source and destination.
