 Distribution Diagram
Distribution Diagram
Distribution DiagramTo make it easier for you to understand all the spreadsheets of the program and to have a more general view of the project, at the bottom of the screen, we have a schematic drawing showing a stacked line where sources, demands, limiters and the distribution after the calculation of the distribution.
Overall, we have:
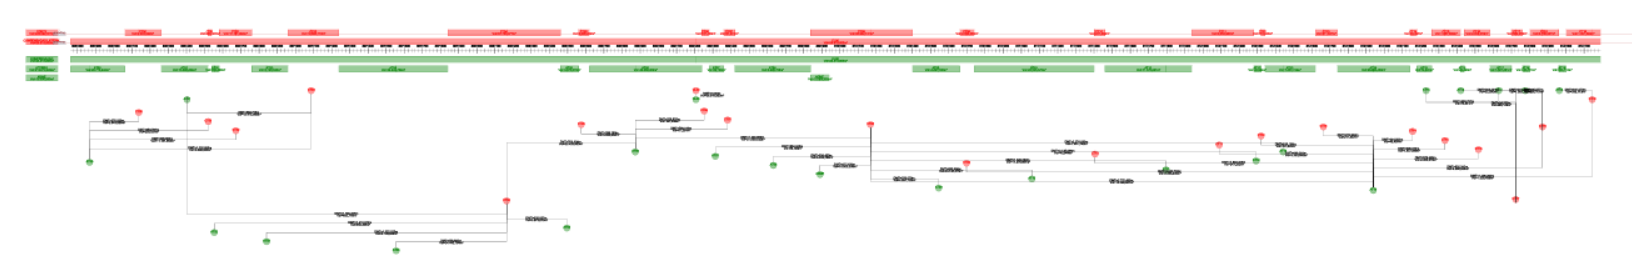
Now, see the intents one by one:
On the left side, you'll see each item Source or Demands with its total volume:
Above and below the axis, we see the items source and demands:
Above all source classified items, we see the Limiters
In sources, we see your ranges:
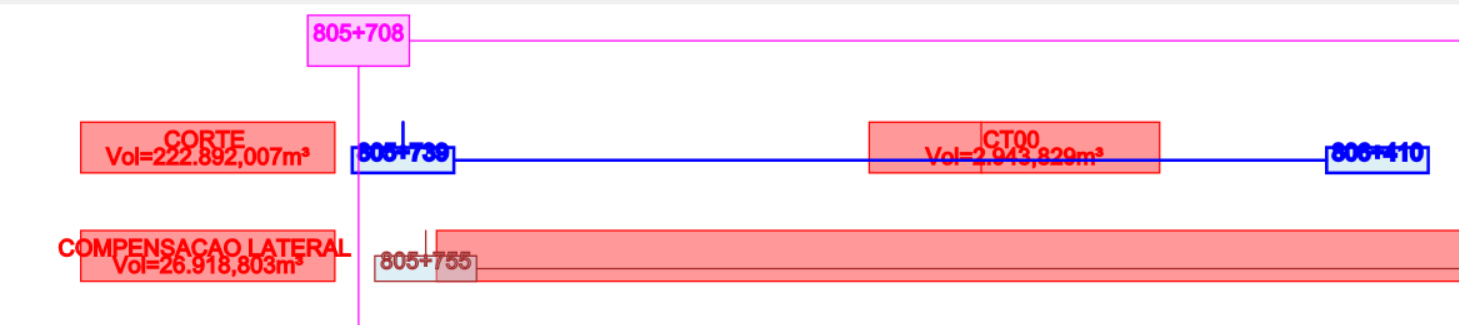
Finally, we see the calculated movements:
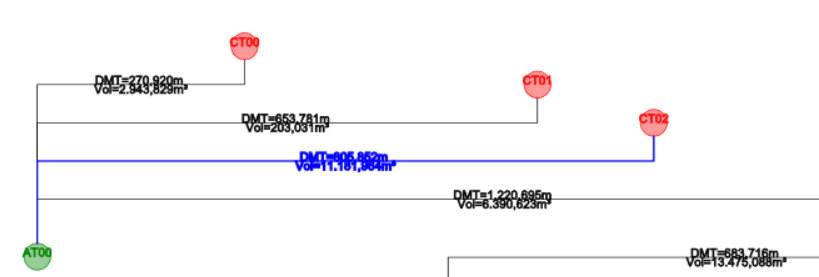
Some things can be edited in this diagram.
To do this, click the left button on the item.
Note that it changes to the color
If a source supplies material to multiple demands, or a demand receives material from multiple sources, click the ball with the left mouse button to select, press the CTRL key and click the right mouse button on the ball. movements will be repositioned more legibly.