Main board
In the main board, is what we see all the columns to be calculated on a network.
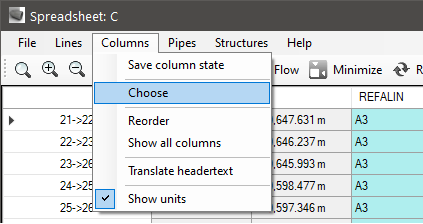
Of course so we can all see, you should mark ALL as visible:

Note: that columns indicate that's name, unit of measure, and if you stop the mouse over the column, you will see the description.
Stopping the mouse on any cell in the spreadsheet, if this cell
monitors the value of maximum and minimum, these will be shown on the screen in a balloon:

The cells may be editable or not.
The yellow background is editable and non-editable has the white background.
In editable you can click with the right mouse button
for commands that make editing more efficient spreadsheet:

Seeing a cell whose font will appear in red, it indicates a problem with the calculated value in this cell.
You can check the column rules
If you see the error cell and display the value in red, stop the mouse over the cell and see:

Obviously, any change in a worksheet cell, will result in recalculation of the spreadsheet.
But beware ! This does not mean that these values will be applied to the design!!
An interesting tip is that you can rearrange the columns.
For this,
click one and drag it to the desired position.
And you can also turn off
some columns, so you can adapt visual spreadsheet for those who
you have used in excel for example.
Finally, we can still save the state of
columns, to not have to organize them at all times:
Licensed version C3DRENSG still allows you to select the entire worksheet, copy and paste the results directly into Excel, making it easy to generate reports and memorials calculus.
The main board will feature several columns, which can be:
 Common Columns