Sewage Specific Parameters
The following specific parameters are shown for sewers.
They are shown in Table parameters along with the general parameters of the spreadsheet.
K1 coefficient
Coefficient day higher consumption, typically 1.2
K2 coefficient
coefficient hour of greatest consumption, typically 1.5, applied only on QMI
Return coefficient
The coefficient of return represents the fraction of the water that returns to sistema coletor sewage, the other party in the gardens or infiltration galleries designed.
This methodology should consider the flow due to infiltration into the sewer network.
Varies according to the table below:
|
Size
|
Coef.
C (%)
|
|
Big Cities
|
85
|
|
Middle Cities
|
80
|
|
Small Towns
|
70
|
Initial Population
Total population to be served from the occasion the entry into operation of the network.
Note: that it is only the population served by this network.
If more than one sewage system exists, this should be only one population served by this network.
Final Population
Is the total population served by the end of the period of occupation of the area where the network is deployed.
Note: that it is only the population served by this network.
If more than one sewage system exists, this should be only one population served by this network.
The final population can be estimated by:
-
arithmetic method
When the projection period is less than five years:
P = P2 + Ka * (t - t2)
Ka = (p2 - p1)/(t2 - t1)
Where
P1: population penultimate sense
P2: the last census population
t1: the penultimate year of the sense
t2: year of the last census
t: year of the projection
Q: estimated population projection for the year
-
geometric method
Also for periods of projection is less than 5 years:
kg = (ln (P2) - ln (P1))/(T2 - T1)
P2 = P * e ^ (kg * (T - T2))
Where
P1: Population of the penultimate sense
P2: Population of the last census
T1: the penultimate year of the sense
T2: year of the last census
T: year of the projection
P: Estimated population projection for the year.
-
logistic curve method
P = K / (1 + e ^ (a – b * t))
K = (2 * P0 * P1 * P2 – (P1 ^ 2) * (P0 + P2)) / (P0 * P2 – P1 ^ 2)
b = - (1) / (0.4343 * d) * log ((P0 * (K – P1)) / (P1 * (K-P0)))
a = (1) / (0.4343) * log ((K-P0) / P0)
t = a / b
Where
P0 = Population on the time T0
P1 = Population on the time T1
P2 = Population on the T2 time
P = Estimated population projection for the year
T1 - T0 = T2 - T1
P1, P1 and P2 must be such that P0 P0, P1 and P2 must be such that P0 * P2 d = constant interval between the years T0, T1 and T2
 These calculations can be done by clicking the right mouse button on the line of the final population:
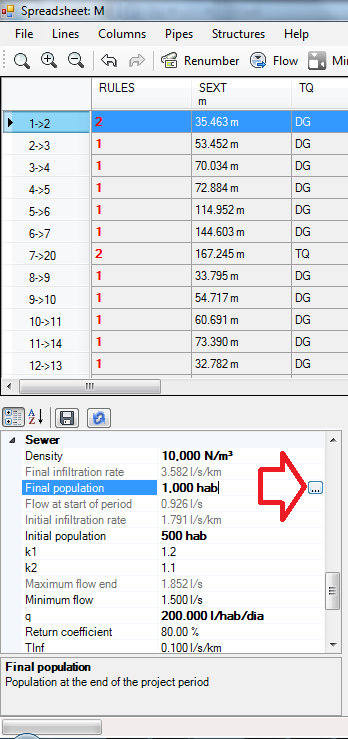
appears this screen:

Fill it and the final population will be calculated.
Consumer
consumption per capita micro-measured, typically 200 l/capita/day
can be estimated by the following table:
community size
|
range population
(hab.)
|
consumption per capita
(l/inhab.
Day)
|
|
rural town
|
<5,000
|
90-140
|
|
Village
|
5,000 - 10,000
|
100-160
|
|
Small town
|
10,000 - 50,000
|
110-180
|
|
City
|
50000-250000
|
120-220
|
|
Big City
|
> 250,000
|
150-300
|
infiltration rate
The ABNT NBR 9649, says:
"IT contribution rate of infiltration depends on local conditions such as:
-
Level of
groundwater
-
Underground nature
-
Quality of execution of the network
-
Pipe material and joint type used
The value between 0.05 and 1.0 L/s.
Km adopted should be justified.
"
contribution rate in initial gear
This value is obtained by the formula:
TI = QMI/SEXTFIC
Where QMI is given by:
QMI = (K2 * CTR * PINI * Q)
contribution rate in the final
This value is obtained by the formula:
TF = QMF/SEXTFIC
Where QMF is given by:
QMF = (K1 * K2 * CTR * PFIM * Q)
Respected coefficient for unit conversion.
trative tension
the flow of sewage through the pipe should be such that the trative tension sludge is greater than or equal to the minimum tractive tension in order to ensure that it does not settle on it.
In general, this value is assumed to be 1 Pa (Pascal).
Acceleration of gravity
Adopted as 9.81 m/s².
Do not change it unless you know what you're doing!!
Minimum flow
To calculate flow flowing in some passages, seal it is below minimum flow, this will be adopted.
A hydra valve discharges about 1.5 l/s, which is the default value adopted.
All these values can be saved to the file once C3DRENESG.ini, to be reused in other projects.
To do this click the right mouse button on the box parameters and click:
