Graphics
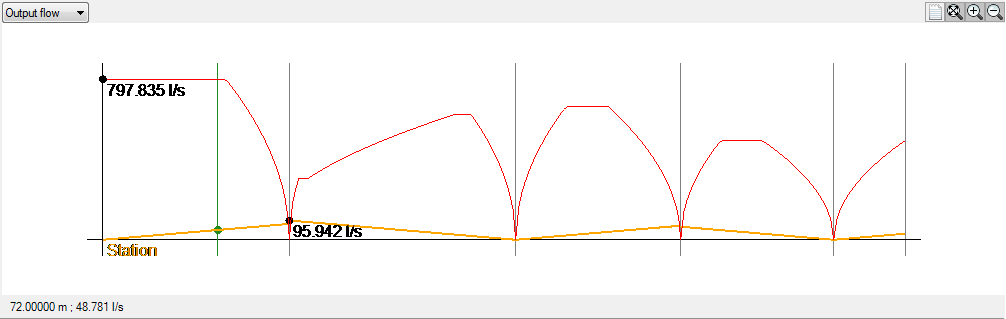
shows a schematic of the graphs of the gutter.
They can be:
-
Flow out - Displays the calculated flow in each section and also the allowable flow to that section
-
Water height - water height calculated in each section, comparing with the water height and the maximum critical height
-
Flow Speed - speed in each section, compared with the maximum permissible speed for the cross section
You can also change the colors of this screen.
See parameters frame.
You can change the zoom:
-
 enhance
-
 reduce
-
 " Zoom Extents "
-
Double click mouse also zooms extents
-
Clicking the wheel and move is " zoom pan "
-
Spinning the mouse wheel will zoom dynamic
button  allows to see the spreadsheet with the data they generate graphs
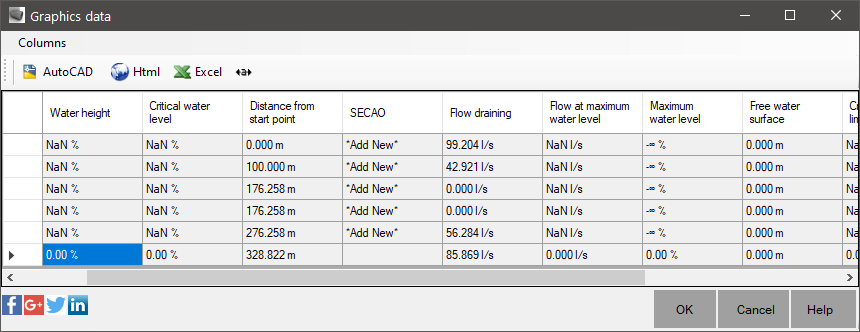
The columns are:
-
EST - Distance of the amount
-
DECL - Slope of greide at station.
The profile must be set using the command
 SARJPROPS
-
Hlam - water height calculated for the section height
-
HC - Height calculated critical to the section and slope
-
HCMIN - Lower limit of the critical height (0.9 * HC)
-
HCMAX - Upper limit of the critical height (1.1 * HC)
-
VESC - speed flow
-
QFC - Flow leaking section
-
QMAX - Maximum flow that can flow in the section already discounted clearance
-
HLMAX - maximum water height that can seep in section already discounted clearance
 See:
See:
 Plant
Plant