 SWMM - Time Series - Evaporation
An Evaporation Time Series describes the variation of the evaporation rate as a function of time
They are used in  Climatology when evaporation is controlled by a time series.
Note that for each date specified in the time series, the evaporation rate remains constant at the value given for that date until the next date in the series is reached (that is, no interpolation is used in the series).
This series has the following properties:
- Identification
- Description (Description, String) - Use a friendly description when the item name is not enough
- Name (Name, String) - name of the item
Avoid names that are too long, or that contain the following characters: '*', '>', '<', '/', '\', '"', ':', ';', '|', '=', '`', '#', ',', '?'
- Object
- Priority (Priority, Enum) - Information about the current state of the item. Could it be:
 Neutral: no problem
 Critical: Some issue that prevents the item from being calculated or used
- Error Evaluation (CurveError, CurveError) - Result of data evaluation
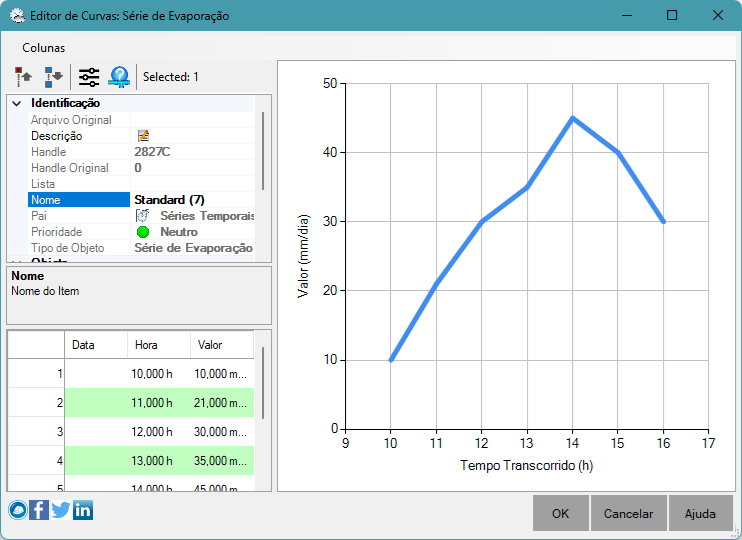
- Curve Data (CurveData, IListClonavel) - the time series data, with the columns:
- Date (Date, Double) - the date value for multi-day simulations
- Time (Time, Double) - the time value on the day specified in the date (if any)
- Value (Value, Double) - the value to use
- SWMM
- Start Date (StartDate, Double) - Date when the simulation starts
- Start Time (StartTime, Double) - Time of day the simulation starts
- End Date (EndDate, Double) - Date when the simulation ends
- End Time (EndTime, Double) - Time of day when the simulation ends
The data are entered into the table and plotted on the graph for better visualization:
See also: Time Series